What is a double top pattern?
A double top is a chart pattern that signals a negative reversal, or the end of an uptrend. It consists of two peaks at roughly the same price level, separated by a trough that forms the neckline. The pattern is generally considered confirmed when price breaks below the neckline, which may indicate that upward momentum is weakening and a potential reversal is developing.
Key takeaways
- A double top is an M-shaped bearish reversal chart pattern that usually forms after an uptrend.
- The pattern consists of two peaks at roughly the same price level, separated by a trough that forms the neckline.
- A double top is generally considered confirmed when price breaks below the neckline.
- False breakouts can occur, so traders often use other technical signals and risk-management tools alongside the pattern.
Is a double top bullish or bearish?
A double top is strictly a bearish pattern (the bullish variant is known as a double bottom). It usually occurs after a strong upward move that has lost momentum. The fact that the price stalled at the previous top suggests that resistance has proven to be too strong and buyers are no longer in control.
How to identify a double top
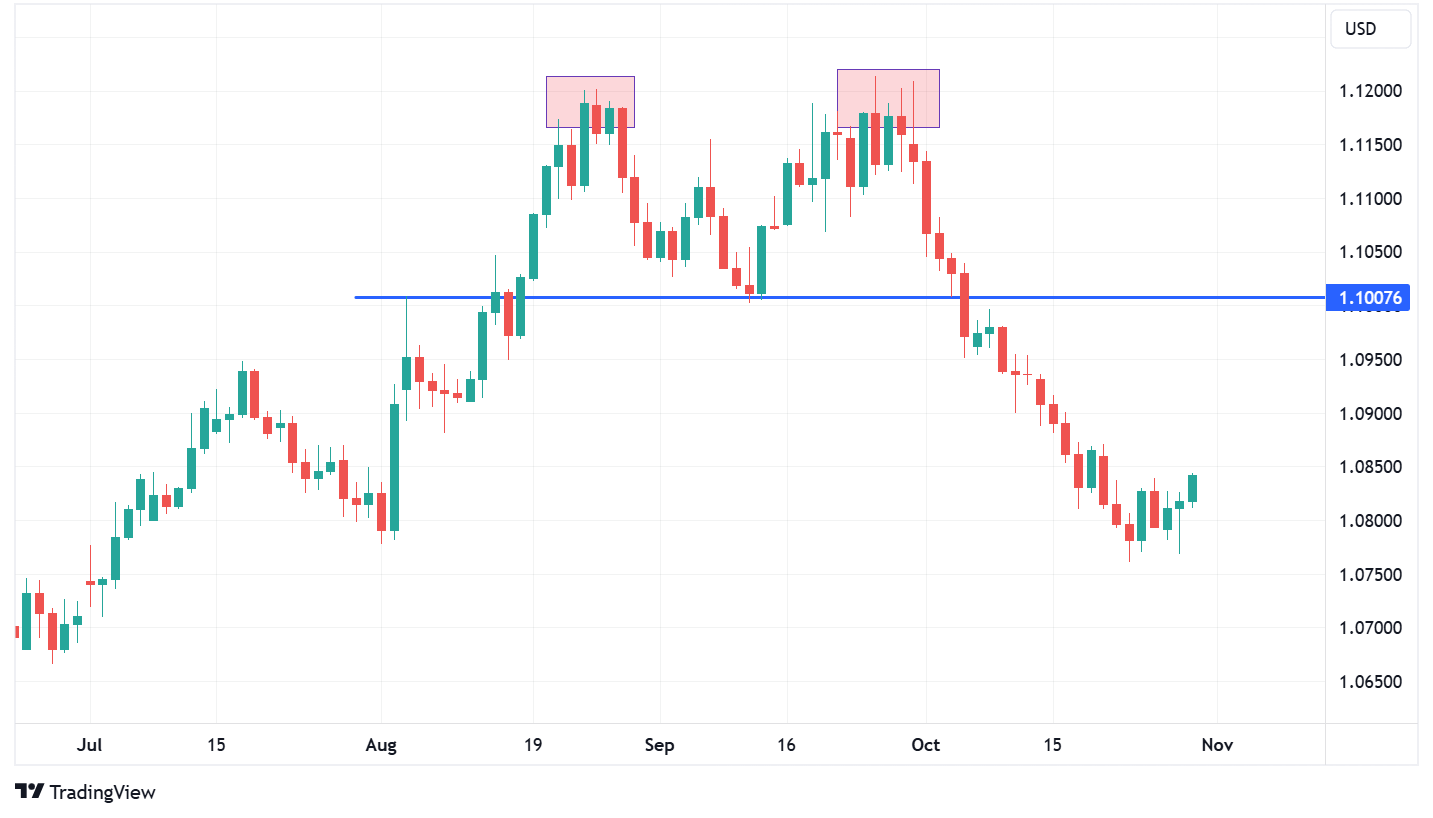
A double top is characterised by its two consecutive peaks. They do not have to be exactly at the same level but should be relatively close.
A key component of the double top pattern is the neckline, the support level between the two peaks that must be breached to confirm the pattern.
Once the price of the asset breaks below the neckline, a double top is confirmed, signalling a potential downward trend.
The double top pattern suggests that the asset initially gained momentum and reached a new high but then lost its upward drive. After a temporary pullback, bullish forces regained control, but upon retesting the previous high, bearish sentiment prevailed.
The neckline's significance lies in its ability to indicate a reversal. A break below it suggests that the upward trend has reversed and a downward move is likely to follow.
Double top vs. double bottom
A double bottom is a bullish reversal pattern, similar to the double top but indicating the end of a downtrend.
It consists of two consecutive lows, or bottoms, and a neckline. When the price moves away from the second bottom, it suggests that sellers may be losing control and the downward momentum is weakening. A breakout above the neckline confirms the double bottom and signals a potential upward trend.
How to trade a double top chart pattern
To trade a double top pattern, you must be able to identify it. Look for two peaks that are located at approximately the same level, separated by a price decline, or "valley."
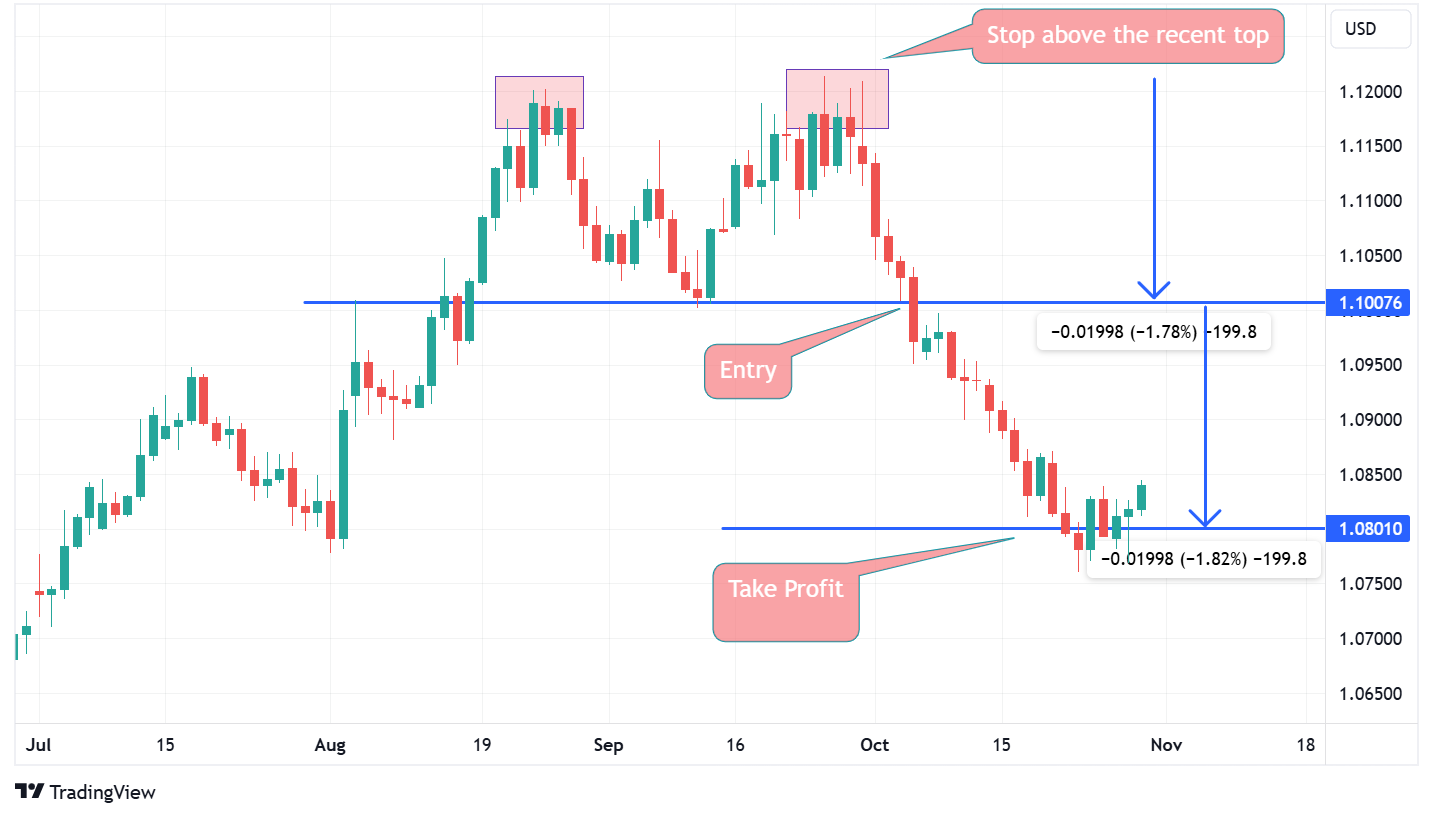
The neckline is the support level that is formed at the valley between the two peaks. This level is crucial, as the actual entry takes place once the price has breached below this level.
Once price breaks below the neckline, some traders use the breakout as confirmation of the pattern. Others wait for a close below the neckline or for price to retest the former support level before considering an entry.
It is important to wait for a confirmation of the pattern, which occurs when the price breaks below the neckline. Although entering a short position early, when the price starts to move away from the second peak, it might seem tempting and potentially offer better entry points and higher profits, but it also increases the risk of false signals.
Once you are in the trade, it is important to set a stop-loss to protect yourself against excessive losses. Traders will typically place the stop-loss slightly above the second peak. If the distance is significant, you may consider reducing your position size.
The take-profit target is calculated by measuring the distance between the peaks and the neckline. For example, if the distance is 100 pips, set the take-profit level to 100 pips below the neckline.
Advantages of a double top
The double top pattern has several advantages:
- It is easy to identify due to its simple structure, consisting of two peaks and a valley.
- The neckline provides a well-defined entry point. While stop-loss and take-profit targets can vary, the distance between the neckline and the peak offers a helpful reference.
- It is exclusively a bearish pattern, signalling a potential downward trend.
- It applies across various trading instruments and asset classes, as well as different timeframes.
- It can be combined with technical indicators for additional confirmation.
Disadvantages of a double top
Despite its advantages, the double top pattern also has its drawbacks:
- As with any chart pattern, it is possible for false breakouts to occur. For example, the price may break below the neckline but then reverse, continuing its uptrend.
- The standard practice of placing the stop-loss above the most recent peak and the take-profit based on the neckline-peak distance can lead to a less favourable risk-to-reward ratio due to the wider stop-loss.
- Chart patterns are not "perfect." The two peaks might not be perfectly aligned, and the neckline might be less obvious to identify.
- Double top patterns are better used in trending markets, as too many false signals can occur during a consolidation.
Ready to trade your edge?
Join thousands of traders and trade CFDs on forex, shares, indices, commodities, and cryptocurrencies!
This information is not to be construed as a recommendation; or an offer to buy or sell; or the solicitation of an offer to buy or sell any security, financial product, or instrument; or to participate in any trading strategy. It has been prepared without taking your objectives, financial situation and needs into account. Any references to past performance and forecasts are not reliable indicators of future results. Axi makes no representation and assumes no liability with regard to the accuracy and completeness of the content in this publication. Readers should seek their own advice.
FAQs
A double top is a chart pattern that signals a potential reversal from an uptrend to a downtrend. It is characterised by two consecutive peaks of approximately the same height, separated by a valley or trough.

Milan Cutkovic
Milan Cutkovic is an experienced trader and market analyst specializing in forex, indices, commodities, and stocks. He was one of the first traders accepted into the Axi Select program, which identifies talented traders and supports their professional development.
He is passionate about helping others improve their trading skills through educational articles, eBooks, and content published on the Axi blog. His work is regularly featured and quoted in major international media outlets, including Yahoo Finance, Business Insider, Barron's, CNN, Reuters, New York Post, and MarketWatch.