What is a symmetrical triangle pattern?
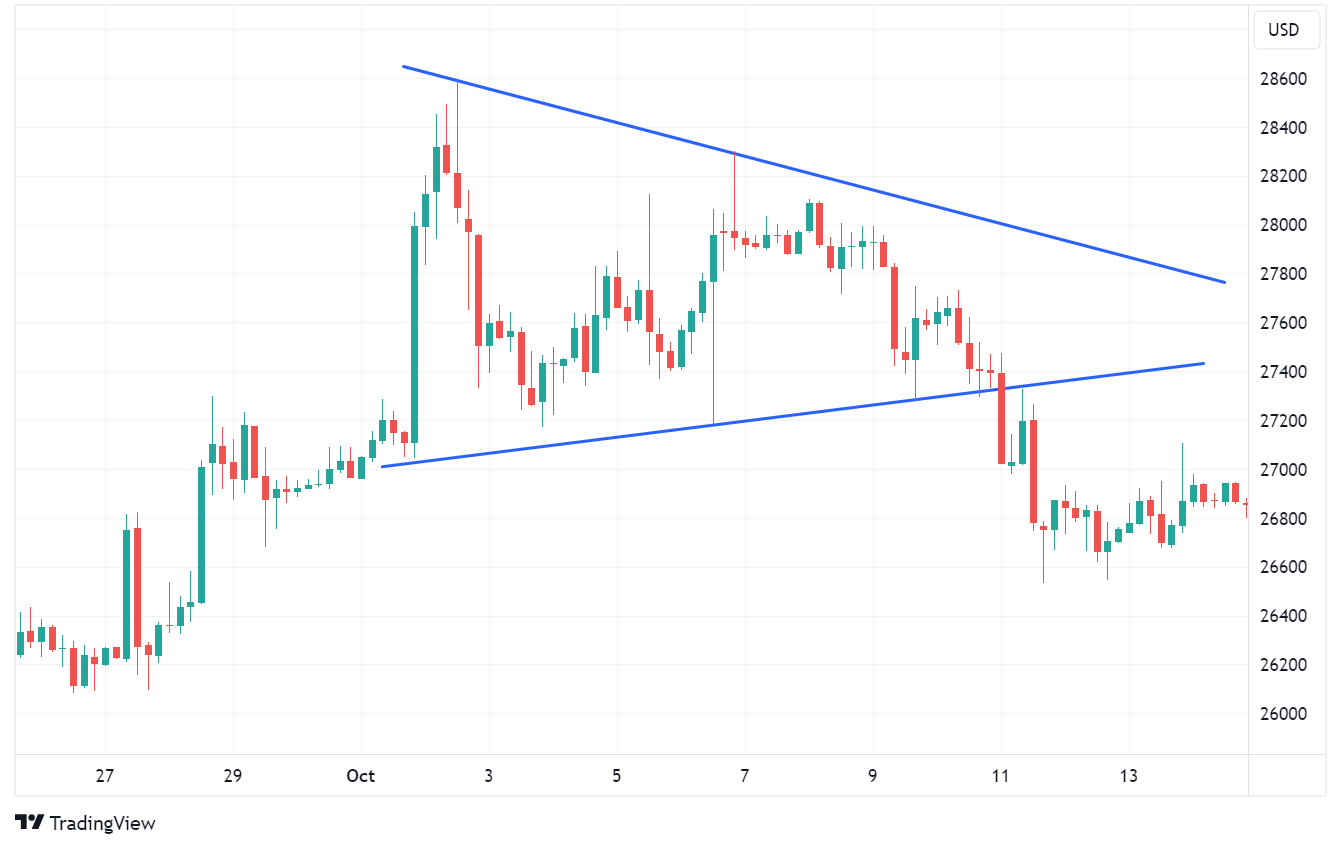
A symmetrical triangle is a neutral technical chart pattern that consists of two converging trendlines. One trendline consists of a series of lower highs, acting as resistance. The other trendline consists of a series of higher lows, acting as support. Eventually, those trendlines will meet, forming a triangle.
The symmetrical triangle suggests that there is some consolidation going on. Traders will wait for a breakout, which could occur on either side. While some traders will use the pattern on its own to generate an entry signal (i.e., the breakout), others will use technical indicators, such as the momentum indicator, for further confirmation.
Is a symmetrical triangle bullish or bearish?
A symmetrical triangle can be either bullish or bearish, depending on the direction of the breakout.
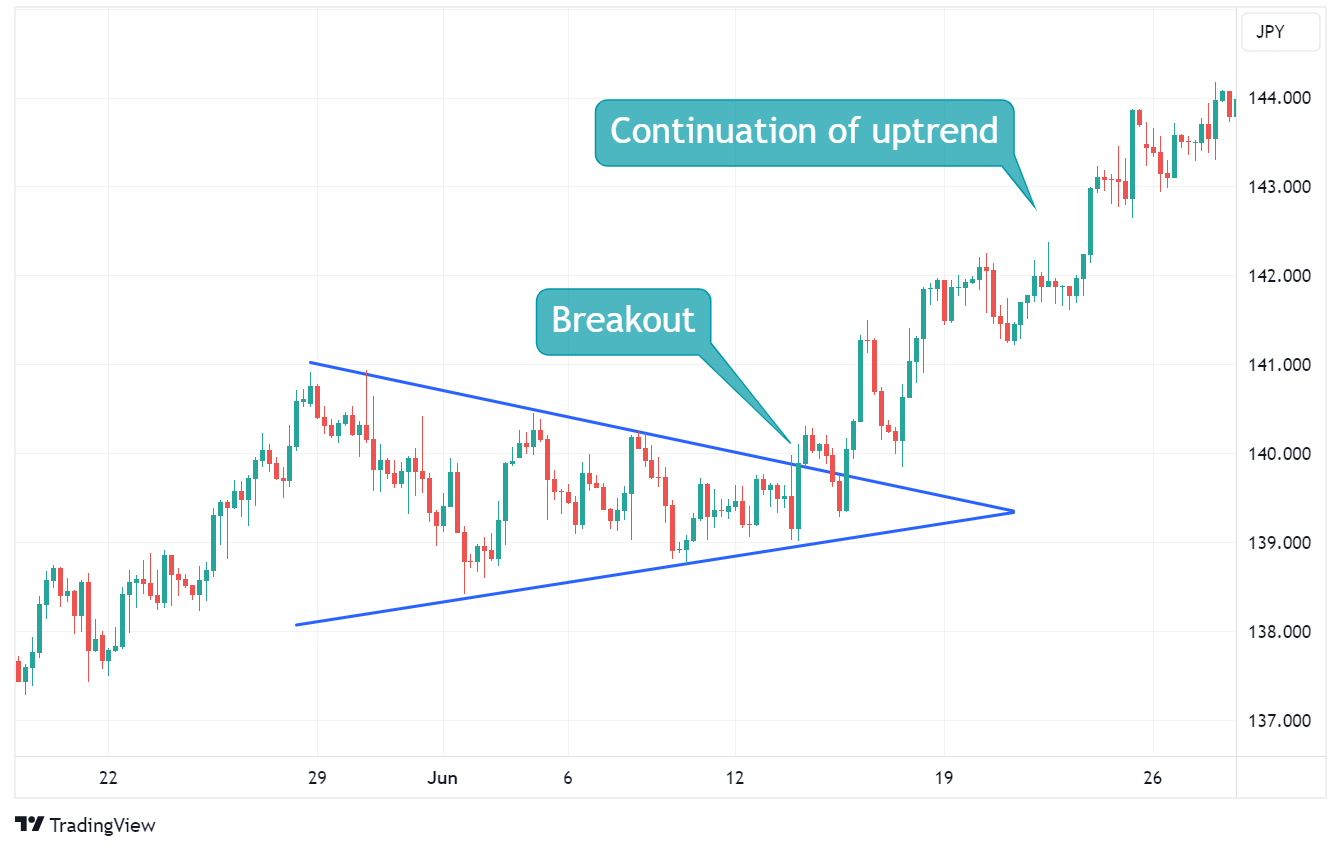
A bullish breakout occurs when the price breaks above the upper trendline. If the instrument is already in an uptrend, the breakout is seen as a sign that the price will continue moving upwards. If the instrument is in a downtrend, it is seen as a sign that there could be a reversal.
On the other hand, when the price breaks below the lower trendline, it is considered as a bearish breakout. If the instrument is in an existing downtrend, the breakout may suggest the price will continue moving in the same direction. If the instrument is currently in an uptrend, it can signal a potential reversal.
How to identify a symmetrical triangle pattern
Symmetrical triangles are easy to spot and consist of only two trendlines. Look for a series of lower highs and higher lows on the chart. Connect the lower highs with a trendline; this will represent resistance. Proceed then to draw a trendline connecting the higher lows, which will form the support line.
The trendlines should converge towards each other, forming a triangle. The triangle does not need to look "perfect", but the lines should converge fairly symmetrically.
How to trade a symmetrical triangle pattern
First, identify the symmetrical triangle as outlined above.
Consider the direction of the trend. Triangles are generally seen as continuation patterns, so breakouts that indicate a continuation of the prevailing trend are seen as stronger signals.
Once you spot the triangle pattern, wait for the breakout to occur, which could happen in either direction.
In the event of a bullish breakout, consider seizing the opportunity to enter a long position on the instrument. To manage risks effectively, set a stop-loss just below the upper trendline. Conversely, if a bearish breakout occurs, consider initiating a short position while employing a stop-loss above the lower trendline to mitigate potential losses.
To reduce the risk of false breakouts, you can use indicators to validate the signals or wait for a retest of the breakout point.
Advantages of symmetrical triangles
- Easy to recognise: Symmetrical triangles are easy to spot, even for beginners.
- Simple to define entry/exit points: The entry signal is clear, with traders anticipating a breakout either above the upper trendline or below the lower trendline. This also makes it easier to define the stop-loss and take-profit levels.
- Different timeframes: Symmetrical triangles appear on all timeframes, from minute to monthly charts, providing opportunities for both short- and long-term traders.
- Compatibility with other tools: Since this is a simple chart pattern, it can easily be combined with other indicators for additional confirmation.
Disadvantages of symmetrical triangles
- False breakout: Symmetrical triangles, like many chart patterns, are prone to false breakouts. Despite an initial breakout signal, the price movement might swiftly reverse, leading to triggering stop-loss orders or premature position liquidation for traders.
- Signal quantity vs. quality: Short-term charts have a higher frequency of symmetrical triangles, which can overwhelm traders. This abundance, however, may degrade signal quality, necessitating thorough filtering to identify the most dependable trading possibilities.
- Lack of trend: When an instrument consolidates within a symmetrical triangle pattern without a clear underlying trend, it tends to produce a higher occurrence of false breakouts.
Ready to trade your edge?
Join thousands of traders and trade CFDs on forex, shares, indices, commodities, and cryptocurrencies!
The images shown are for illustration purposes only. This information is not to be construed as a recommendation; or an offer to buy or sell; or the solicitation of an offer to buy or sell any security, financial product, or instrument; or to participate in any trading strategy. It has been prepared without taking your objectives, financial situation and needs into account. Any references to past performance and forecasts are not reliable indicators of future results. Axi makes no representation and assumes no liability with regard to the accuracy and completeness of the content in this publication. Readers should seek their own advice.

Milan Cutkovic
Milan Cutkovic is an experienced trader and market analyst specializing in forex, indices, commodities, and stocks. He was one of the first traders accepted into the Axi Select program, which identifies talented traders and supports their professional development.
He is passionate about helping others improve their trading skills through educational articles, eBooks, and content published on the Axi blog. His work is regularly featured and quoted in major international media outlets, including Yahoo Finance, Business Insider, Barron's, CNN, Reuters, New York Post, and MarketWatch.