The world's largest corporations shape global markets, influence economic stability and drive innovation across industries ranging from energy and pharmaceuticals to technology. Because of their size and reach, these companies draw close scrutiny from investors for their financial performance, market influence and social responsibility.
However, judging which organisation is genuinely "at the top" is entirely dependent on perspective. As data for 2026 show, "largest" and "richest" are not always synonymous. A corporation may be regarded "large" because it has a massive global workforce or a large base of physical assets, but another may be labelled "richest" because it generates unequalled net profits and liquid wealth.
Each section defines the metric followed by a top 10 ranking.
Top 10 largest companies by market capitalisation
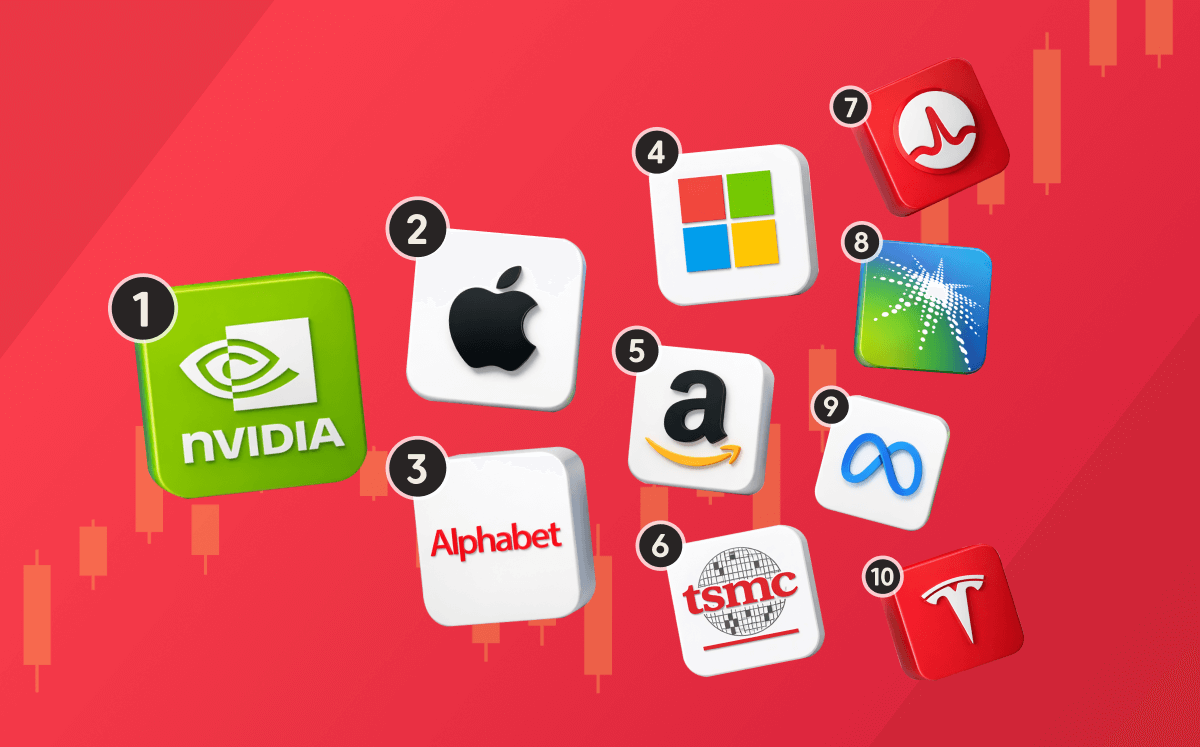
Market capitalisation is one of the most useful criteria for determining a company's size and value. This is the total dollar value of a company's outstanding shares of stock and is calculated using the following formula:
Market cap = total shares * current share price
This value represents what the investment community believes a company is worth at the time, or the "price tag" required to acquire the entire entity. In the 2026 market, this statistic continues to place tech giants like Nvidia and Apple at the top, as investors bank on their continued growth in the AI and hardware sectors.
| # | Company | Ticker | Market Cap |
| 1 | NVIDIA | NVDA | 5.27T |
| 2 | Apple | AAPL | 4.77T |
| 3 | Alphabet | GOOG | 4.04T |
| 4 | Microsoft | MSFT | 3.66T |
| 5 | Amazon | AMZN | 2.72T |
| 6 | TSMC | TSM | 2.22T |
| 7 | SpaceX | SPCX | 1.95T |
| 8 | Broadcom | AVGO | 1.72T |
| 9 | Saudi Aramco | 2222 | 1.68T |
| 10 | Meta | META | 1.64T |
Trade Stock CFDs with Axi
Trading involves a high risk of investment loss.
Top 10 largest companies in the world by country
While the United States leads in global market capitalisation, every major economy has its own "national champions". These corporate engines serve as the foundation of a country's geopolitical influence and are often considered "too big to fail". They generate substantial tax revenue and employ a significant portion of the local population.
Beyond economics, these companies symbolise a country's industrial and technological prestige. In 2026, the global landscape shows a growing sectoral divide:
- United States: The AI boom has concentrated wealth in the technology sector.
- Middle East: Energy remains the undisputed source of economic power.
- Europe: Luxury goods and high-precision manufacturing continue to distinguish the region's top performers.
United States of America (USA)
| # | Company | Ticker | Market Cap |
| 1 | NVIDIA | NVDA | 5.27T |
| 2 | Apple | AAPL | 4.77T |
| 3 | Alphabet | GOOG | 4.04T |
| 4 | Microsoft | MSFT | 3.66T |
| 5 | Amazon | AMZN | 2.72T |
| 6 | SpaceX | SPCX | 1.95T |
| 7 | Broadcom | AVGO | 1.72T |
| 8 | Meta | META | 1.64T |
| 9 | Tesla | TSLA | 1.43T |
| 10 | Micron | MU | 1.10T |
European Union (EU)
| # | Company | Ticker | Market Cap (USD) |
| 1 | ASML | ASML | $650B |
| 2 | Siemens | SIE | $247B |
| 3 | LVMH | MC | $244B |
| 4 | SAP | SAP | $244B |
| 5 | L'Oreal | OR | $240B |
| 6 | Banco Santander | SAN | $216B |
| 7 | Inditex | ITX | $205B |
| 8 | Novo Nordisk | NVO | $200B |
| 9 | TotalEnergies | TTE | $199B |
| 10 | Allianz | ALV | $193B |
United Kingdom (UK)
| # | Company | Ticker | Market Cap (USD) |
| 1 | HSBC | HSBA | $355B |
| 2 | Shell | SHELL | $274B |
| 3 | AstraZeneca | AZN | $247B |
| 4 | Linde | LIN | $213B |
| 5 | Rolls-Royce Holdings | RR | $162B |
| 6 | Rio Tinto | RIO | $161B |
| 7 | Unilever | ULVR | $132B |
| 8 | BP | BP | $119B |
| 9 | British American Tobacco | BTI | $118B |
| 10 | GlaxoSmithKline | GSK | $96B |
United Arab Emirates (UAE)
| # | Company | Ticker | Market Cap (USD) |
| 1 | International Holding Company | IHC | $219B |
| 2 | TAQA | TAQA | $81B |
| 3 | ADNOC Gas | ADNOCGAS | $68B |
| 4 | First Abu Dhabi Bank | FAB | $59B |
| 5 | Emirates NBD Bank PJSC | EMIRATESNBD | $52B |
| 6 | Emirates Telecom (Etisalat Group) | EAND | $51B |
| 7 | Dubai Electricity and Water Authority | DEWA | $38B |
| 8 | Abu Dhabi Commercial Bank (ADCB) | ADCB | $34B |
| 9 | Emaar Properties | EMAAR | $26B |
| 10 | ADNOC Drilling | ADNOCDRILL | $25B |
China
| # | Company | Ticker | Market Cap (USD) |
| 1 | CXMT | 688825 | $601.45B |
| 2 | Tencent | TCEHY | $499.52B |
| 3 | China Construction Bank | 601939 | $422.73B |
| 4 | Agricultural Bank of China | 601288 | $355.35B |
| 5 | ICBC | 1398 | $342.92B |
| 6 | Bank of China | 601988 | $309.42B |
| 7 | Alibaba | BABA | $275.54B |
| 8 | PetroChina | 0857 | $243.43B |
| 9 | Kweichow Moutai | 600519 | $240.60B |
| 10 | CATL | 300750 | $232.75B |
Japan
| # | Company | Ticker | Market Cap (USD) |
| 1 | Mitsubishi UFJ Financial | MUFG | $262.14B |
| 2 | SoftBank Group Corp. | 9984 | $241.90B |
| 3 | Toyota | TM | $227.93B |
| 4 | KIOXIA Holdings Corporation | 285A | $191.90B |
| 5 | Sumitomo Mitsui Financial Group | SMFG | $168.12B |
| 6 | Tokyo Electron | 8035 | $151.73B |
| 7 | Hitachi | 6501 | $151.03B |
| 8 | Advantest | 6857 | $148.69B |
| 9 | Recruit | 6098 | $139.72B |
| 10 | Sony | SONY | $137.40B |
Canada
| # | Company | Ticker | Market Cap (USD) |
| 1 | Royal Bank of Canada | RY | $284.16B |
| 2 | Toronto Dominion Bank | TD | $195.68B |
| 3 | Shopify | SHOP | $163.72B |
| 4 | Bank of Montreal | BMO | $120.26B |
| 5 | Scotiabank | BNS | $112.81B |
| 6 | Enbridge | ENB | $105.32B |
| 7 | Canadian Natural Resources | CNQ | $104.89B |
| 8 | CIBC | CM | $103.53B |
| 9 | Agnico Eagle Mines | AEM | $99.75B |
| 10 | Brookfield Corporation | BN | $84.65B |
Australia
| # | Company | Ticker | Market Cap (USD) |
| 1 | BHP Group | BHP | $230B |
| 2 | Commonwealth Bank | CBA | $185B |
| 3 | Westpac Banking | WBC | $84B |
| 4 | National Australia Bank | NAB | $84B |
| 5 | ANZ Bank | ANZ | $80B |
| 6 | Macquarie Group | MQG | $68B |
| 7 | Wesfarmers | WES | $60B |
| 8 | CSL | CSL | $57B |
| 9 | Woodside Energy | WDS | $46B |
| 10 | Goodman Group | GMG | $39B |
Top 10 biggest companies in the world by number of employees
While market capitalisation represents investor confidence, headcount measures a company's direct impact on people. This metric measures the individuals globally who rely on a single corporation for their livelihood.
In 2026, a large workforce often indicates a labour-intensive company model. Sectors like retail, logistics, and manufacturing rely heavily on human resources to function rather than the lean teams of high-tech "unicorns". Consequently, these enormous corporations serve as primary economic engines for millions of households.
2026 employment landscape:
- Walmart and Amazon continue to dominate by the number of employees worldwide. However, headcount and profit often diverge, as an "employer giant" may support millions of jobs while generating lower profit than a small, automated software firm.
- In many regions, these corporations are more than businesses: they are foundations of social stability and the largest private contributors to national pension and insurance systems.
| # | Company | Ticker | Employees |
| 1 | Walmart | WMT | 2,100,000 |
| 2 | Amazon | AMZN | 1,546,000 |
| 3 | BYD | 002594 | 968,900 |
| 4 | JD.com | JD | 900,000 |
| 5 | Foxconn | 2317 | 826,608 |
| 6 | Accenture | ACN | 791,000 |
| 7 | Volkswagen | VOW3 | 656,134 |
| 8 | Tata Consultancy Services | TCS | 607,979 |
| 9 | DHL Group (Deutsche Post) | DHL | 594,879 |
| 10 | Compass Group | CPG | 580,000 |
The largest companies by revenue
Revenue is the total income a company generates from selling goods and services before expenses are deducted. It is a common measure of the scale of a company's day-to-day operations.
Historically, this list has been dominated by retailers and energy giants, or businesses that move physical goods or power the world.
Retail: Amazon and Walmart are among the world's highest-revenue companies. Amazon leads this ranking, while Walmart remains close behind, supported by the scale of its grocery and physical retail operations.
Energy: Saudi Aramco and other state-owned energy companies frequently hold the top spots, although their revenue varies dramatically depending on global oil prices. Unlike retail, which is typically stable, an energy company's "size" in terms of revenue might fluctuate by billions in a single quarter.
Volume vs. value: significant revenue does not automatically imply significant profit. These companies have a vast economic "footprint", but they frequently operate at lower margins than smaller, high-tech firms that provide digital services rather than physical inventories.
| # | Company | Ticker | Revenue |
| 1 | Amazon | AMZN | $716.9B |
| 2 | Walmart | WMT | $713.2B |
| 3 | State Grid Corporation of China | — | $545.9B |
| 4 | Saudi Aramco | 2222 | $480.4B |
| 5 | China National Petroleum | — | $476.0B |
| 6 | UnitedHealth Group | UNH | $447.6B |
| 7 | Sinopec | 600028 | $429.7B |
| 8 | Apple | AAPL | $416.0B |
| 9 | CVS Health | CVS | $399.83B |
| 10 | Berkshire Hathaway | BRK/B | $371.4B |
The most profitable businesses by net income
While revenue shows the scale of a company's sales, net income is the accounting profit remaining after expenses such as salaries, taxes, interest and R&D are deducted. It is a key measure of profitability, but it is not the same as cash available to shareholders.
In 2026, the global leaderboards reveal that, although retail and energy move the most products, technology and semiconductors move the most wealth.
Companies like Alphabet and Apple may have fewer employees than retail giants, yet their "earnings per person" are staggering. They focus on high-margin digital ecosystems where the cost of selling to the next million users is nearly zero.
For the first time, Nvidia is challenging for the top spot in net income. As the primary architect of the AI boom, it operates with massive profit margins that allow it to generate more "liquid wealth" per dollar of revenue than almost any firm in history.
Saudi Aramco remains a profit powerhouse, but its earnings are a "commodity story", highly dependent on global oil prices. In contrast, the tech titans are "platform stories," generating consistent profit through software subscriptions and hardware loyalty.
A company can be an "employer giant" while remaining less profitable than a small, high-tech firm. True wealth in 2026 is defined by scalability, or the ability to grow profits without needing to grow the workforce at the same rate.
| # | Company | Ticker | Net Income |
| 1 | Alphabet | GOOGL | $132.2B |
| 2 | NVIDIA | NVDA | $120.1B |
| 3 | Apple | AAPL | $112.0B |
| 4 | Saudi Aramco | 2222 | $104.7B |
| 5 | Microsoft | MSFT | $101.8B |
| 6 | Amazon | AMZN | $77.7B |
| 7 | Berkshire Hathaway | BRK/B | $66.9B |
| 8 | Meta Platforms | META | $60.5B |
| 9 | JPMorgan Chase | JPM | $57.5B |
| 10 | ICBC | 1398 | $49.0B |
The richest companies by total assets
Total assets are the sum of everything a company owns, including cash, real estate, and "intangibles" like patents and brand value. This metric reveals the resources a company has available to survive downturns or fund new ventures.
While tech giants lead in market value, financial institutions dominate asset rankings because their "products"- loans and cash reserves - sit directly on the balance sheet.
China's "Big Four", led by ICBC, continue to hold the top global spots. With assets exceeding $7.3 trillion, ICBC's balance sheet is larger than the GDP of most nations.
JPMorgan Chase remains the leader in the West, with total assets of approximately $4.43 trillion in this ranking.
| # | Company | Ticker | Total Assets |
| 1 | ICBC | 1398 | 7.3T |
| 2 | Agricultural Bank of China | 601288 | 6.8T |
| 3 | China Construction Bank | 601939 | 6.2T |
| 4 | Bank of China | 601988 | 5.27T |
| 5 | JPMorgan Chase | JPM | 4.43T |
| 6 | Fannie Mae | FNMA | 4.31T |
| 7 | Freddie Mac | FMCC | 3.44T |
| 8 | Bank of America | BAC | 3.4T |
| 9 | BNP Paribas | BNP | 3.36T |
| 10 | HSBC | HSBC | 3.23T |
The companies with the highest net assets
While total assets show a company's arsenal, net assets (or book value) reveal what it actually owns. Calculated as total assets minus total liabilities, this metric represents the residual value belonging to shareholders if the company were liquidated today.
Unlike total assets, which debt can inflate, net assets reflect a company's true equity and its resilience against economic crises.
In 2026, Berkshire Hathaway leads the private sector with a "war chest" of $381.7 billion in cash and Treasury bills, an unparalleled safety net which provides a buffer that few other corporations can match.
Global banks like ICBC and JPMorgan Chase have trillions in total assets, but because customer deposits are (technically) liabilities, their net assets are significantly lower. They are giants of scale, but their ownership is highly leveraged.
For tech leaders like Apple and Nvidia, net assets are low relative to their multi-trillion-dollar market caps. Their primary value lies in "intangibles" like brand loyalty, patents, and AI algorithms, which are not fully captured on a traditional balance sheet.
| # | Company | Ticker | Net Assets (Equity) |
| 1 | Berkshire Hathaway | BRK/B | $717.4B |
| 2 | ICBC | 1398 | ~$595.0B |
| 3 | China Construction Bank | 601939 | ~$505.0B |
| 4 | Bank of China | 601988 | ~$465.0B |
| 5 | Agricultural Bank of China | 601288 | ~$455.0B |
| 6 | Saudi Aramco | 2222 | ~$447.0B |
| 7 | Alphabet (Google) | GOOGL | $415.3B |
| 8 | Microsoft | MSFT | $390.9B |
| 9 | Amazon | AMZN | $369.6B |
| 10 | JPMorgan Chase | JPM | $360.2B |
Trade Stock CFDs with Axi
Trading involves a high risk of investment loss.
References to forecasts and past performance are not reliable indicators of future results.
The images shown are for illustration purposes only. Data is sourced from third party providers.
This information is for educational purposes only and is not intended to be financial product advice or any investment recommendation. It is not to be construed as a recommendation; or an offer to buy or sell; or the solicitation of an offer to buy or sell any security, financial product, or instrument; or to participate in any trading strategy. It has been prepared without taking your objectives, financial situation and needs into account. Axi makes no representation and assumes no liability with regard to the accuracy and completeness of the content in this publication. Readers should seek their own advice.
FAQs
NVIDIA is currently the most valuable company in the world. According to the data used in this 2026 ranking, NVIDIA has a market capitalisation of approximately $5.27 trillion, ahead of Apple at around $4.77 trillion and Alphabet at approximately $4.04 trillion. Strong demand for AI infrastructure remains one of the key factors supporting NVIDIA's valuation.

Alex Macris
With a background spanning forex, stocks, and crypto, Alex has contributed financial and stock exchange reports to leading publications and news agencies. Beyond financial markets, he honed his skills by researching and editing international agreements and state reports and producing multimedia resources for diverse brands and organisations.
In addition to written content, Alex, who is fluent in English, French, and Greek, brings extensive experience and passion for audio. His portfolio showcases a versatile skill set encompassing podcast production, educational materials, and advertisements. A team player and lifelong learner, he maintains a balanced perspective on both the big picture and the finer details.
Find him on: LinkedIn